Suppose your SQL table has a bunch of spatial points (geographies if you like) with an order in which they need to appear (such as time) and you want to convert them into a LineString, or path.
One option is to convert the points into text, and do a bunch of string manipulation. I’m not so keen on that, even though it’s relatively straightforward if you use FOR XML PATH to do the heavy lifting.
The way I’m going to show you today uses three features that were all introduced in SQL Server 2012, to make life quite easy, and I think quite elegant as well.
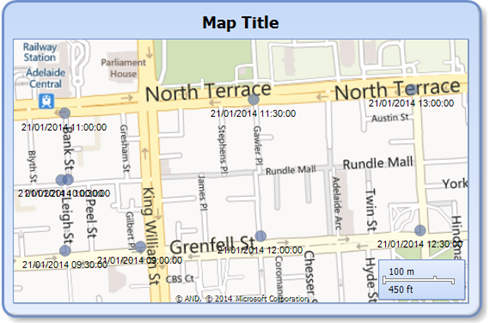
Let’s start by getting some points. I’ve plotted some points around Adelaide. To help, I’m going to use Report Builder to show you the results of the queries – that way, I can put them on a map and you can get a feel for what’s going on, instead of just seeing a list of co-ordinates.
First let’s populate our data, creating an index that will be helpful later on:
|
1 2 3 4 5 6 7 8 9 10 11 12 13 14 15 16 17 18 |
select identity(int,1,1) as id, * into dbo.JourneyPoints from (values (geography::Point(-34.924269, 138.599252, 4326), 'Cnr Currie & KW Sts', cast('20140121 9:00' as datetime)), (geography::Point(-34.924344, 138.597544, 4326), 'Cnr Currie & Leigh Sts', '20140121 9:30'), (geography::Point(-34.923025, 138.597458, 4326), 'Cnr Leigh & Hindley Sts', '20140121 10:00'), (geography::Point(-34.923016, 138.597608, 4326), 'Cnr Bank and Hindley Sts', '20140121 10:30'), (geography::Point(-34.921775, 138.597533, 4326), 'Cnr Bank St and North Tce', '20140121 11:00'), (geography::Point(-34.921520, 138.601814, 4326), 'Cnr North Tce and Gawler Pl', '20140121 11:30'), (geography::Point(-34.924071, 138.601975, 4326), 'Cnr Gawler Pl and Grenfell St', '20140121 12:00'), (geography::Point(-34.923966, 138.605590, 4326), 'Cnr Grenfell and Pulteney Sts', '20140121 12:30'), (geography::Point(-34.921338, 138.605405, 4326), 'Cnr Pulteney St and North Tce', '20140121 13:00') ) p (geo, address, timeatlocation); create index ixTime on dbo.JourneyPoints(timeatlocation) include (geo); select * from dbo.JourneyPoints; |
Great. Starting at the corner of Currie and King William Streets, we wander through the streets, including Leigh St, where the LobsterPot Solutions office is (roughly where the ‘e’ is).
I’ve labelled the points with the times, but it’s still not great viewing. Frankly, it’s a bit hard to see what route was taken.
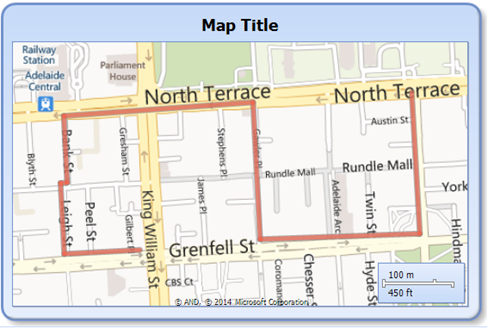
What we really want is to draw lines between each of them. For this, I’m going to find the next point in the set, using LEAD(), and use the spatial function ShortestLineTo to get the path from our current point to the next one.
|
1 2 3 4 5 |
select geo, lead(geo) over (order by timeatlocation) as nextGeo, geo.ShortestLineTo(lead(geo) over (order by timeatlocation)) as lineToNext, timeatlocation from dbo.JourneyPoints; |
I didn’t need to use pull back the fields geo and nextGeo, but I figure that the lineToNext column might be confusing at first glance, since it uses the subsequent row’s position as an argument in a function on the current row’s position. Anyway, hopefully you get the gist, here’s what it looks like.
This is way better – you can see the path that was taken, and can easily tell that the route didn’t just go straight up North Tce, it ducked down Gawler Place instead.
What’s more – with each part of the journey still being a separate row, I can colour each part differently. You know, in case I don’t like the “Tomato” colour in my last example (yes, that colour is called “Tomato”, no matter whether you say it “tomato”, or “tomato”, or even “tomato”).
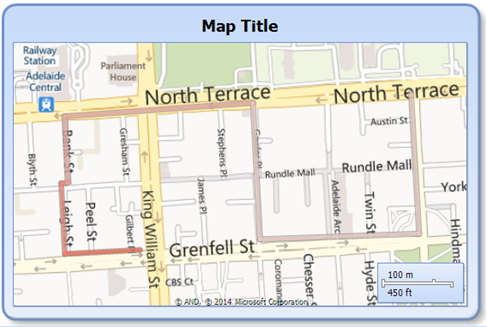
To colour it differently, I’m going to throw in an extra field, which is just the number of minutes since we started. I’ll use the old fashioned OVER clause for that, to count the number of minutes since the earlier time.
|
1 2 3 4 |
select geo.ShortestLineTo(lead(geo) over (order by timeatlocation)) as lineToNext, timeatlocation, datediff(minute, min(timeatlocation) over (), timeatlocation) as minutesSinceStart from dbo.JourneyPoints; |
Cool – now I can easily tell which end it started at (the more tomatoey end), and where it ended (the paler end). Each segment is the same colour, but that’s okay.
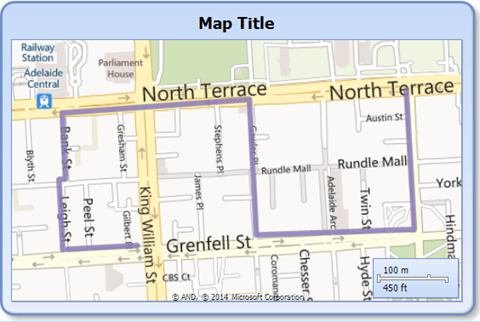
Now, I said I’d use three SQL 2012 features, and so far the only new ones have been LEAD and ShortestLineTo. But remember I still have several rows, and each section of the route is a separate line. Well, to join them up, I’m going to use 2012’s UnionAggregate function. To use this, I need to use a sub-query (I’ll go with a CTE), because I can’t put an OVER clause inside an aggregate function.
|
1 2 3 4 5 6 |
with lines as ( select geo.ShortestLineTo(lead(geo) over (order by timeatlocation)) as LineToNext from dbo.JourneyPoints ) select geography::UnionAggregate(LineToNext) as WholeRoute from lines; |
Now I have my solution! I’ve converted points into lines, in the right order.
You may be wondering how this performs – what kind of execution plan is going to appear.
Well it’s this:
Look at this – there are Stream Aggregates (which just watch the data as it comes through, popping rows out when needed, but never holding onto anything except the aggregate as it grows), a Spool (which is used to do a bit of the windowing trickery, but also holding onto very little), and the Sequence Project & Segment operators which generate a row_number as a marker for the lead function. You might be interested to know that the right-most Stream Aggregate has the following “Defined Value” property:
|
1 2 |
[Expr1005] = Scalar Operator(LAST_VALUE([spatial_test].[dbo].[JourneyPoints].[geo])), [[spatial_test].[dbo].[JourneyPoints].geo] = Scalar Operator(ANY([spatial_test].[dbo].[JourneyPoints].[geo])) |
For each group (which is defined as the row), it uses the LAST_VALUE of geo, and ANY of geo. ANY is the current one, and LAST_VALUE is the row after it. It’s the last row, because the Spool gives up two rows for each ‘window’ – the current row and the lead row. In this scenario, with 9 rows of data in the index, the Spool pulls in (from the right) 9 rows, and serves up (to the left) 17. That’s two per original row, except the last which doesn’t have a lead row.
So the overhead on making this work is remarkably small. With an index in the right order, the amount of work to do is not much more than scanning over the ordered data.
Finally, if I had wanted to do this for several routes, I could have put a RouteID field in the table, used PARTITION BY RouteID in each OVER clause, and GROUP BY RouteID in the final query. If you do this, then you should put routeid as the first key column in your index. That way, the execution plan can be almost identical (just with slightly more explicit grouping, but with identical performance characteristics) to before.
|
1 2 3 4 5 6 7 |
with lines as ( select routeid, geo.ShortestLineTo(lead(geo) over (partition by routeid order by timeatlocation)) as LineToNext from dbo.JourneyPoints ) select routeid, geography::UnionAggregate(LineToNext) as WholeRoute from lines group by routeid; |
But I don’t have a picture of that, because that wasn’t the query I was wanting.


This Post Has 2 Comments
Thanks for posting this, Rob – it solves a hornet’s nest of problems that would have otherwise forced me to write some middleware to surmount.
Well, that was a whole lot simpler than all the other things I’ve been doing (including FOR XML PATH). And I love that you included the last example even though it wasn’t what _you_ wanted, because it’s exactly what _I_ want 🙂
Thanks!