When you get a Analytics Platform System (APS) – the appliance that hosts a copy SQL Server Parallel Data Warehouse Edition (EDW) and potentially a Hadoop cluster as well – one of the things that you get is an Admin Console. It’s quite handy to be able to look at it and see if your appliance is healthy or not.
The trouble with the Admin Console, though, is what I’ve just said – you look at it to assess the health of your appliance. And this isn’t something that you really want to do. What are you going to do – look at it every morning and then get on with your day? If this is what you’re doing to monitor your environment, the chances are you won’t be watching in the moment you start to actually have a problem, and really you’ll be getting the alert when your phone rings, or at least after you’ve picked it up and got an earful of ‘angry customer’.
You need a better solution – something which is going to actually let you know if a problem is detected, and which is going to store some historical information so that you can do some troubleshooting. You know – just like you have on your other SQL boxes. The thing is that PDW doesn’t come with something which can send emails. And it doesn’t come with a scheduler like SQL Agent which can be used to kick off jobs to collect data, or to check perfmon counters in case there’s an issue.
So how do you monitor PDW?
The answer is: from outside it.
Ideally, your organisation has centralised monitoring anyway. Some server(s) that run around checking that everything is healthy. They check the health of the Windows boxes, they see how much disk space is free on all the volumes, they make sure that backups have been taken (not just SQL backups, but backups of whole servers), and run tests like DBCC, restores, and pings. If there’s a problem with the monitoring servers, this is recognised and understood.
Now, you can roll your own one of these, and have it query DMVs like PDW’s sys.dm_pdw_component_health_alerts, sys.dm_pdw_errors, and sys.dm_pdw_os_performance_counters. Collecting this information (and the contents of many other DMVs) can help provide excellent coverage when troubleshooting, and also highlight potential issues before they arrive. Running DBCC PDW_SHOWSPACEUSED from time to time is definitely important, to be conscious of how skew is looking – the list of things to keep an eye on goes on and on.
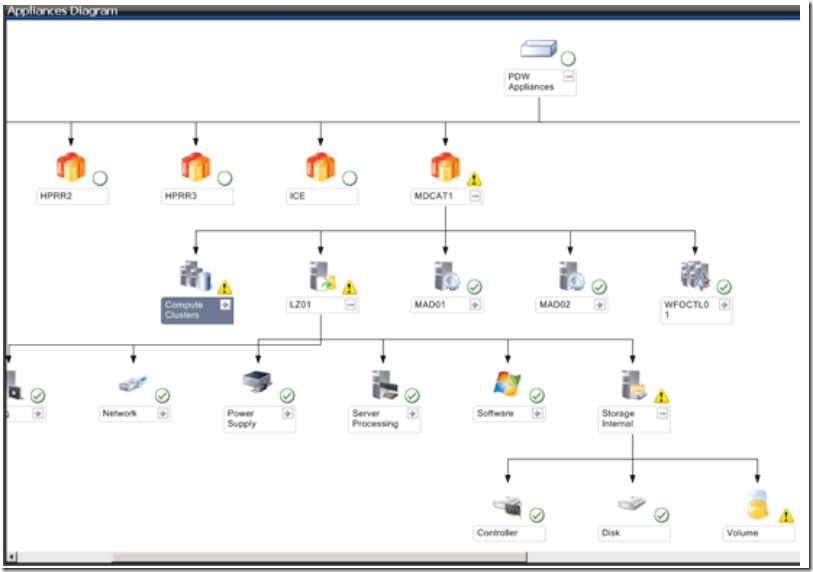
Something that shouldn’t be overlooked is the usefulness of System Center Operations Manager (even if I keep wanting to type ‘Centre’ instead of ‘Center’). There are SCOM Management Packs available to cater for PDW, HDInsight (another component within APS) and APS itself. If SCOM is part of your organisation, then configuring it to monitor your APS appliance is definitely worth doing. I’ve lifted the image here from the APS help file – if you’re at all familiar with SCOM, you’ll recognise it and see that you have good coverage of your APS environment with it. It should never fully replace using queries to look at the metadata within (for assessing skew, etc.), but you should definitely be using SCOM with APS if you can.

I mentioned that this image is part of the APS help file – it goes into quite some detail about setting up SCOM to work with APS, so if you’re considering APS, you should be able to reassure your IT staff that they will be able to use their existing SCOM environment to monitor the appliance still.
Don’t neglect monitoring your APS box. When we get an appliance, it’s easy to let it just sit there and do its stuff, assuming that everything is going to be okay because it’s an appliance. We don’t monitor our kettles at home, but our businesses don’t depend on the health of the kettles (maybe the coffee machine, but that’s a different story). Monitoring doesn’t have to be hard work, but it does have to happen. Luckily, we get a bunch of tools to help us make that happen.
 And this is for yet another T-SQL Tuesday. The first for 2015, and the 62nd in all – hosted this time by Robert Pearl (@pearlknows).