Roger’s been doing a great job extending PivotViewer recently, and you can find the list of LobsterPot pivots at http://pivot.lobsterpot.com.au
Many months back, the TED Talk that Gary Flake did about Pivot caught my imagination, and I did some research into it. At the time, most of what we did with Pivot was geared towards what we could do for clients, including making Pivot collections based on students at a school, and using it to browse PDF invoices by their various properties. We had actual commercial work based on Pivot collections back then, and it was all kinds of fun. Later, we made some collections for events that were happening, and even got featured in the TechEd Australia keynote.
But I’m getting ahead of myself… let me explain the concept.
A Pivot collection is an XML file (with .cxml extension) which lists Items, each linking to an image that’s stored in a Deep Zoom format (this means that it contains tiles like Bing Maps, so that the browser can request only the ones of interest according to the zoom level). This collection can be shown in a Silverlight application that uses the PivotViewer control, or in the Pivot Browser that’s available from getpivot.com. Filtering and sorting the items according to their facets (attributes, such as size, age, category, etc), the PivotViewer rearranges the way that these are shown in a very dynamic way. To quote Gary Flake, this lets us “see patterns which are otherwise hidden”.
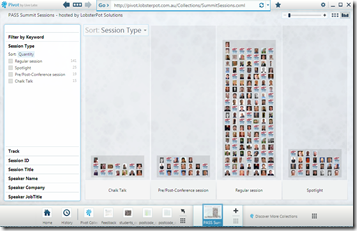
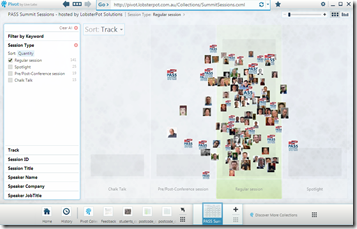
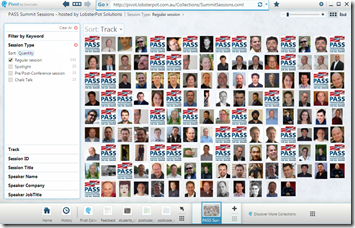
This browsing mechanism is very suited to a number of different methods, because it’s just that – browsing. It’s not searching, it’s more akin to window-shopping than doing an internet search.
When we decided to put something together for the conferences such as TechEd Australia 2010 and the PASS Summit 2010, we did some screen-scraping to provide a different view of data that was already available online. Nick Hodge and Michael Kordahi from Microsoft liked the idea a lot, and after a bit of tweaking, we produced one that Michael used in the TechEd Australia keynote to show the variety of talks on offer.

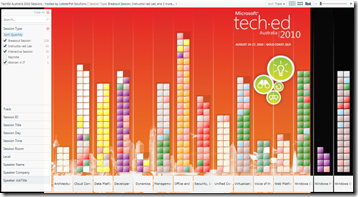
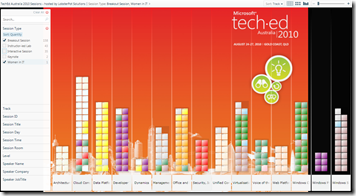
It’s interesting to see a pattern in this data: The Office track has the most sessions, but if the Interactive Sessions and Instructor-Led Labs are removed, it drops down to only the sixth most popular track, with Cloud Computing taking over.
This is something which just isn’t obvious when you look an ordinary search tool. You get a much better feel for the data when moving around it like this.
The more observant amongst you will have noticed some difference in the collection that Michael is demonstrating in the picture above with the screenshots I’ve shown. That’s because it’s been extended some more.
At the SQLBits conference in the UK this year, I had some interesting discussions with the guys from Xpert360, particularly Phil Carter, who I’d met in 2009 at an earlier SQLBits conference. They had got around to producing a Pivot collection based on the SQLBits data, which we had been planning to do but ran out of time. We discussed some of ways that Pivot could be used, including the ways that my old friend Howard Dierking had extended it for the MSDN Magazine. I’m not suggesting I influenced Xpert360 at all, but they certainly inspired us with some of their posts on the matter
So with LobsterPot guys David Gardiner and Roger Noble both having dabbled in Pivot collections (and Dave doing some for clients), I set Roger to work on extending it some more. He’s used various events and so on to be able to make an environment that allows us to do quick deployment of new collections, as well as showing the data in a grid view which behaves as if it were simply a third view of the data (the other two being the array of images and the ‘histogram’ view).
I see PivotViewer as being a significant step in data visualisation – so much so that I feature it when I deliver talks on Spatial Data Visualisation methods. Any time when there is information that can be conveyed through an image, you have to ask yourself how best to show that image, and whether that image is the focal point. For Spatial data, the image is most often a map, and the map becomes the central mode for navigation. I show Pivot with postcode areas, since I can browse the postcodes based on their data, and many of the images are recognisable (to locals of South Australia).
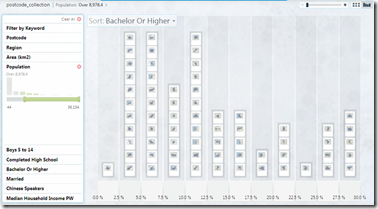
Naturally, the images could link through to the map itself, and so on, but generally people think of Spatial data in terms of navigating a map, which doesn’t always gel with the information you’re trying to extract. Roger’s even looking into ways to hook PivotViewer into the Bing Maps API, in a similar way to the Deep Earth project, displaying different levels of map detail according to how ‘zoomed in’ the images are.
Some of the work that Dave did with one of the schools was generating the Deep Zoom tiles “on the fly”, based on images stored in a database, and Roger has produced a collection which uses images from flickr, that lets you move from one search term to another. Pulling the images down from flickr.com isn’t particularly ideal from a performance aspect, and flickr doesn’t store images in a small-enough format to really lend itself to this use, but you might agree that it’s an interesting concept which compares nicely to using Maps.
I’m looking forward to future versions of the PivotViewer control, and hope they provide many more events that can be used, and even more hooks into it.
Naturally, LobsterPot could help provide your business with a PivotViewer experience, but you can probably do a lot of it yourself too. There’s a thorough guide at getpivot.com, which is how we got into it. For some examples of what we’ve done, have a look at http://pivot.lobsterpot.com.au. I’d like to see PivotViewer really catch on a data visualisation tool.
This Post Has One Comment
Incidentally – it’s Roger’s 30th birthday tomorrow (Dec 30). I’m sure you’ll join me in wishing him a happy birthday.