Real-time Power BI sets are a really useful feature, and there’s a good description of them at https://docs.microsoft.com/en-us/power-bi/connect-data/service-real-time-streaming. I thought I’d do a quick walkthrough specifically around the Push side, and show you – including the odd gotcha that you might not have noticed.
To create a dataset that you want to push data into, you need to go to the Power BI service, go to your Workspace, and create a Streaming dataset. Even if you’re not wanting to use it with a streaming service, this is the one you need.
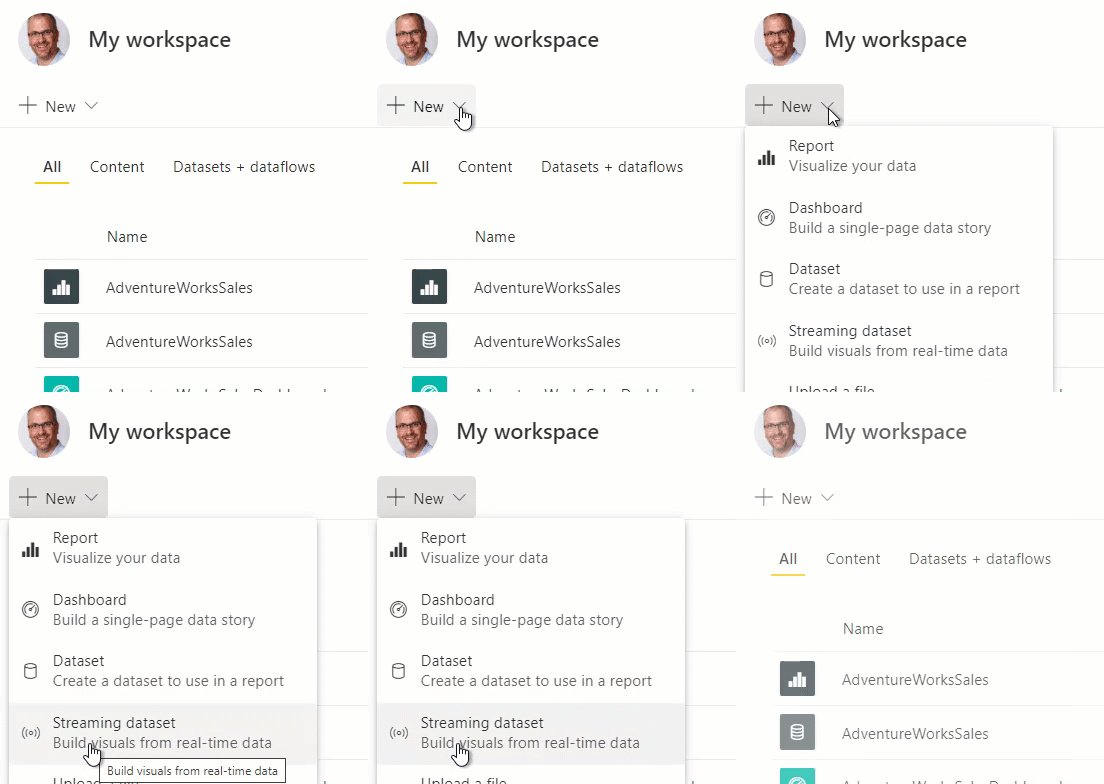
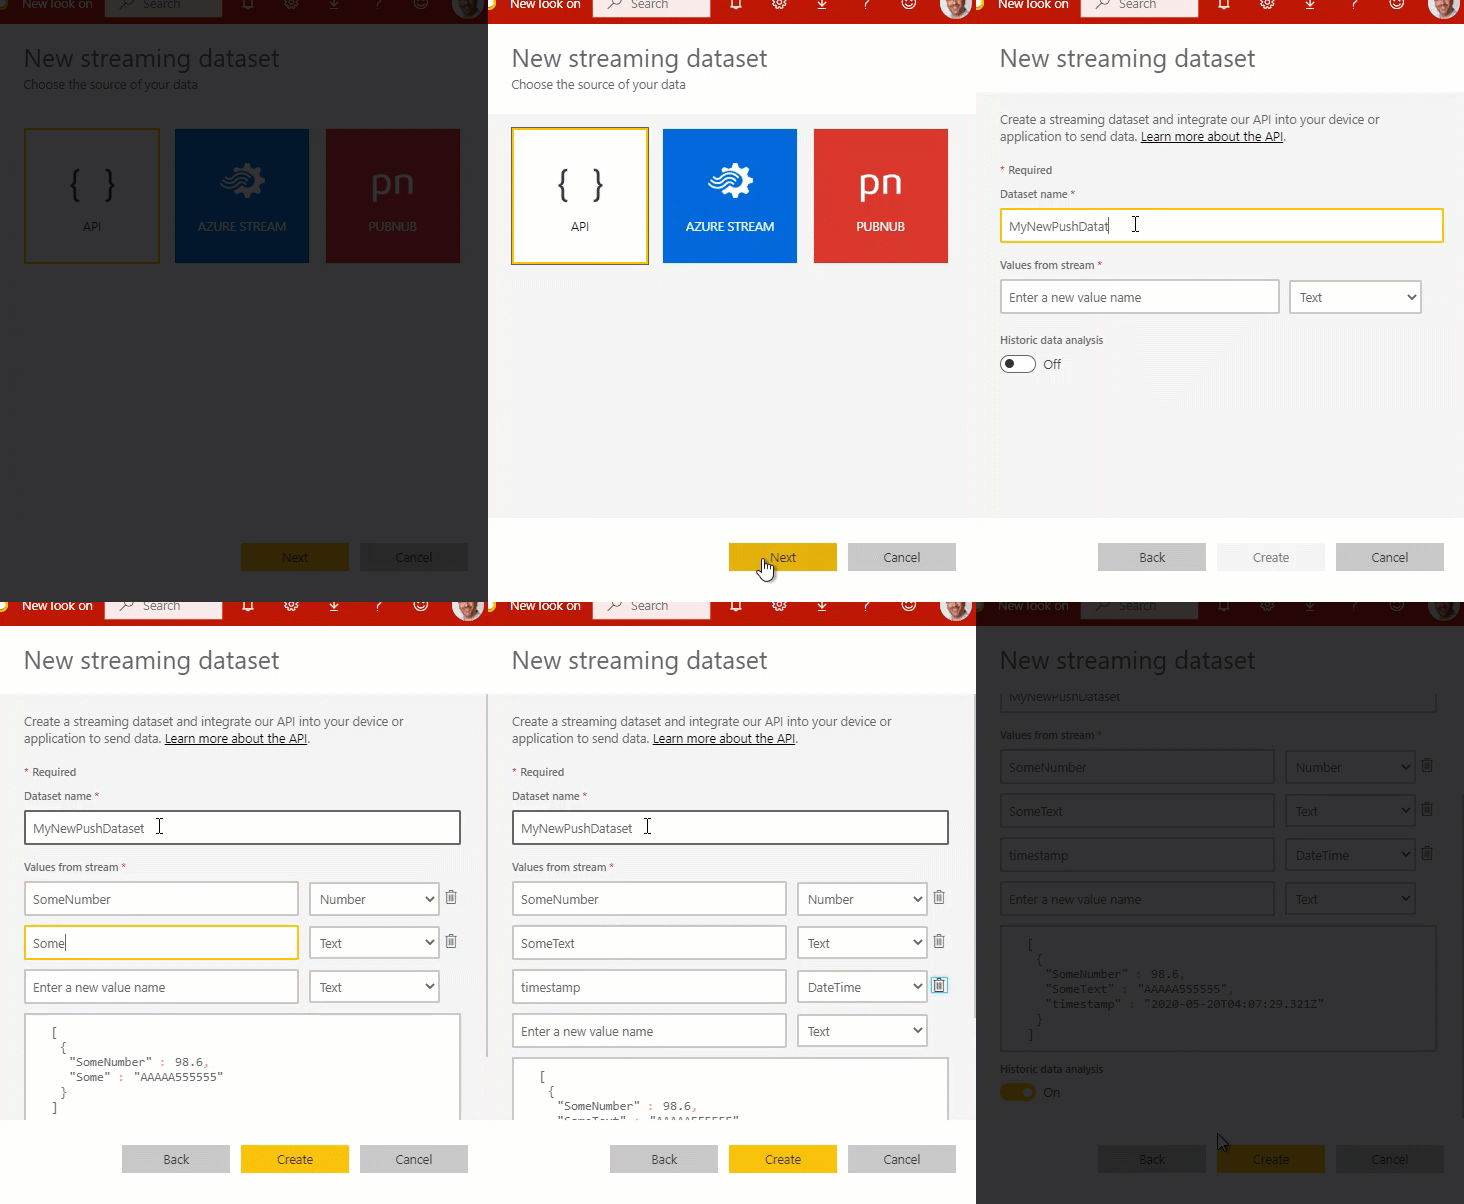
Having said I want to create a dataset, I need to tell it that I want to use this via the API, rather than using Azure Streaming or PubNub (for more on those, check the documentation link above). I also need to give the dataset a name and define the columns. I only get to put in numbers, text, and datetime values, so for now I’ll use one of each. I’m also going to tell it that I want to enable historical data analysis. You should be careful whether you pick this or not, as we’ll see in a moment.
Once we hit the Create button, we get to a screen that gives us the Push URL and some sample code. This is really useful because you can immediately put some code together to start pushing data in. I can click on that window to grab the code and paste it straight into a script that runs regularly.
(Don’t bother trying that particular endpoint, by the way. I created it for this post and it was long gone before this post was finished.)
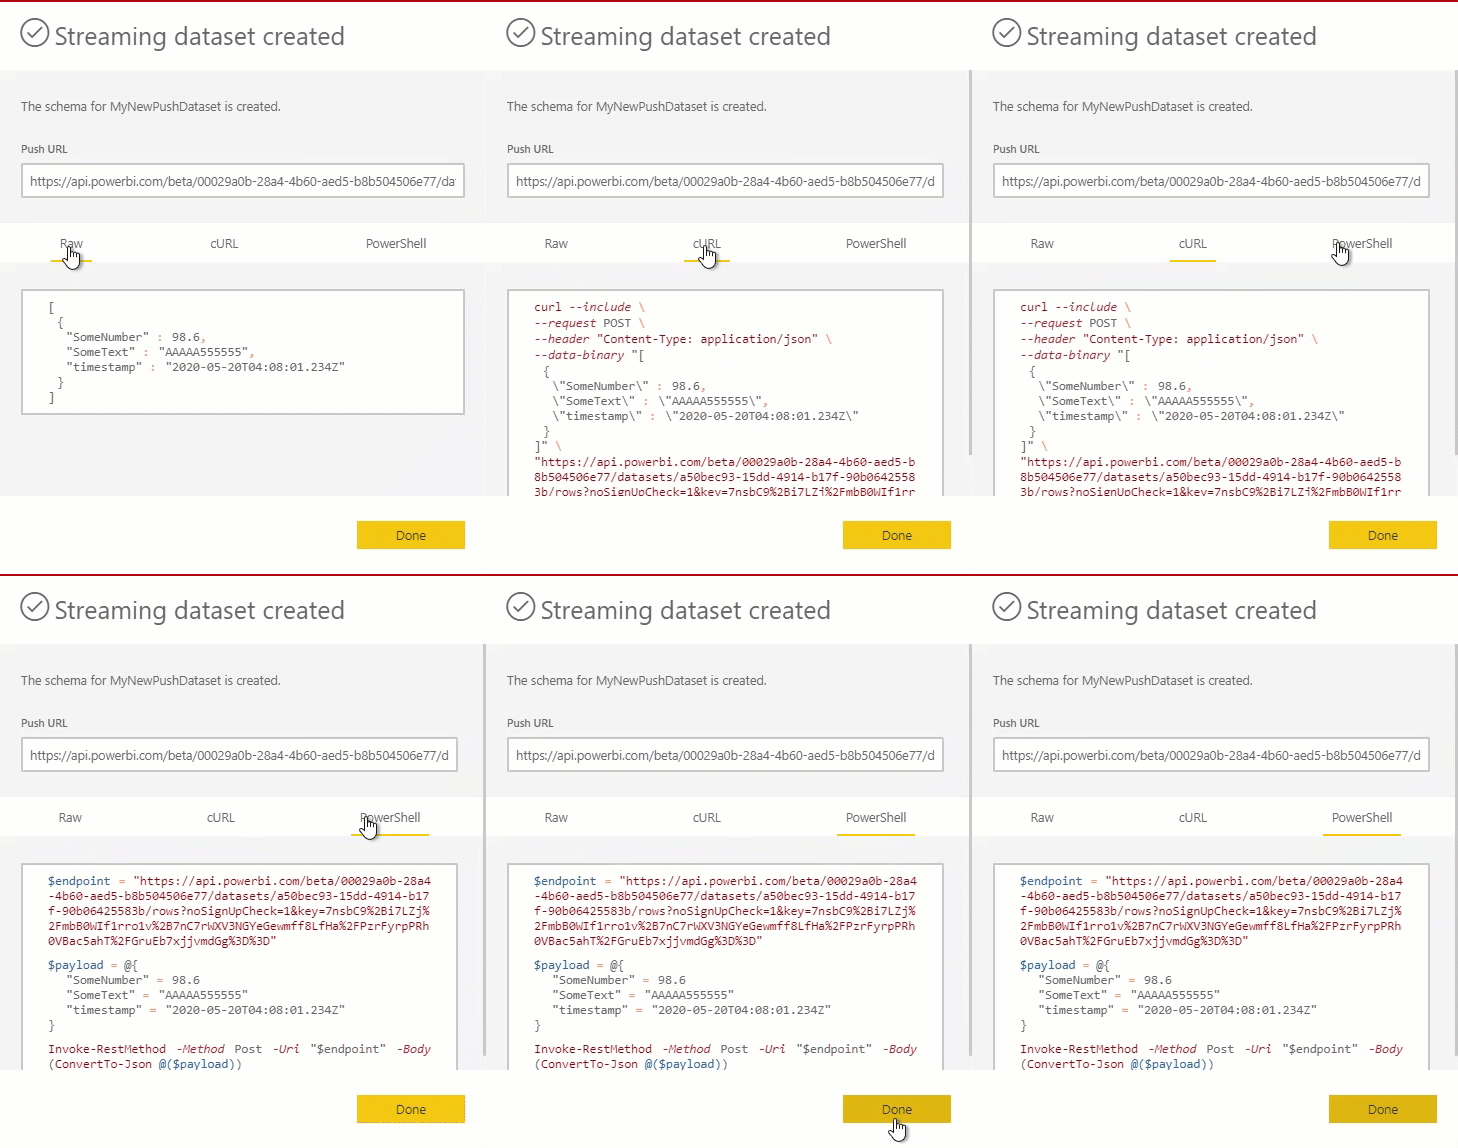
This PowerShell could be kicked off by a number of things. I could poll a database, or have it run when certain conditions are met, or as part of a wider process. And if PowerShell isn’t my thing, then I can use some other method – I just need to post data into a URL.
Let’s talk a bit more about that Historical Data Analysis option.
If I don’t choose that option, then the data hangs around for an hour and then disappears. That might be fine, but it might not. Also, I only get to use this data in a dashboard tile with a handful of visuals – not in reports at all.
If I do choose the Historical Data Analysis option, then 200k rows of data will hang around for me (that’s not a configurable value), and I can even use the data in reports.
Let’s explore this.
In a dashboard there’s an Add tile option under the ellipsis.
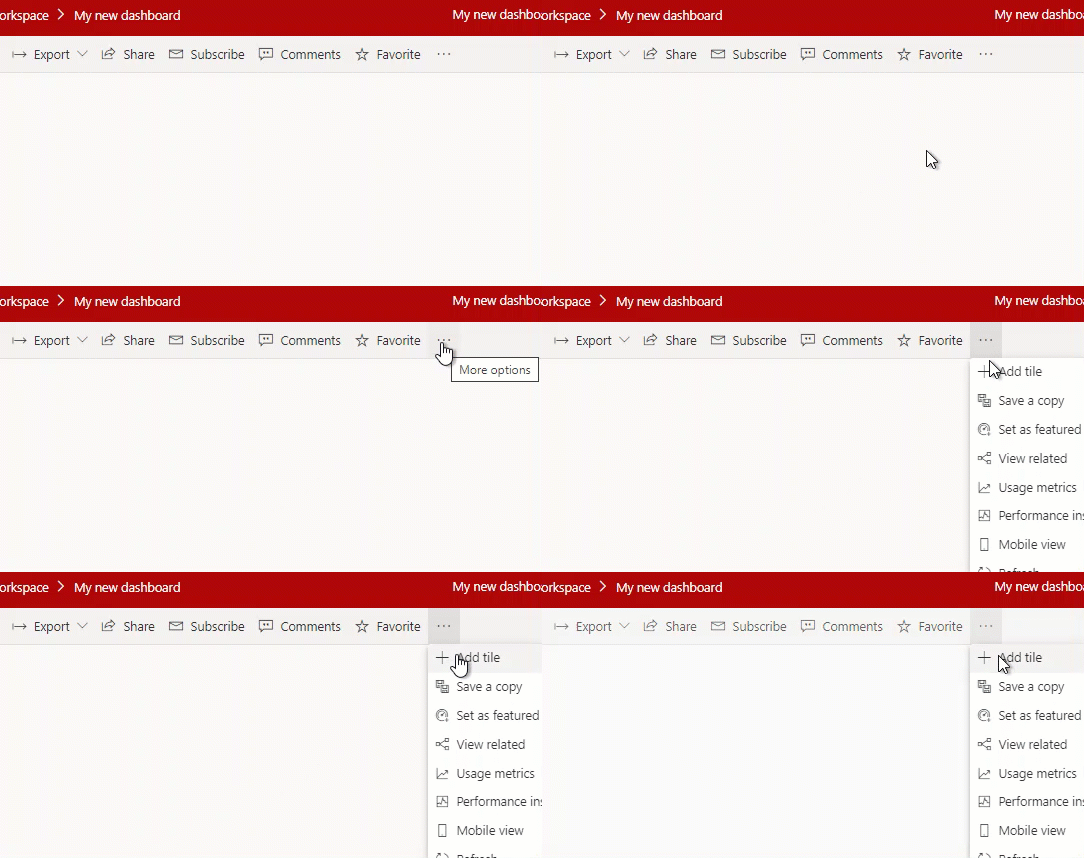
Amongst the tiles that I can add is a Real Time tile for Custom Streaming Data.
The fact that it’s Real Time means that it will refresh when the dataset underneath refreshes – which is absolutely what we want here if we’re going to be showing this on a screen somewhere. Then we can choose the dataset we want, but the tiles we can use are very limited. Only Card, Gauge, and a few types of chart. And things are limited even more, because a Card can only show the number data, not text or datetime.
Suppose I tell it to display a Card, and then I run the PowerShell code repeatedly to push newer and newer data in – the tile updates with the new data almost immediately and this is great. Someone viewing this dashboard can get near-real-time updates from an application or script.
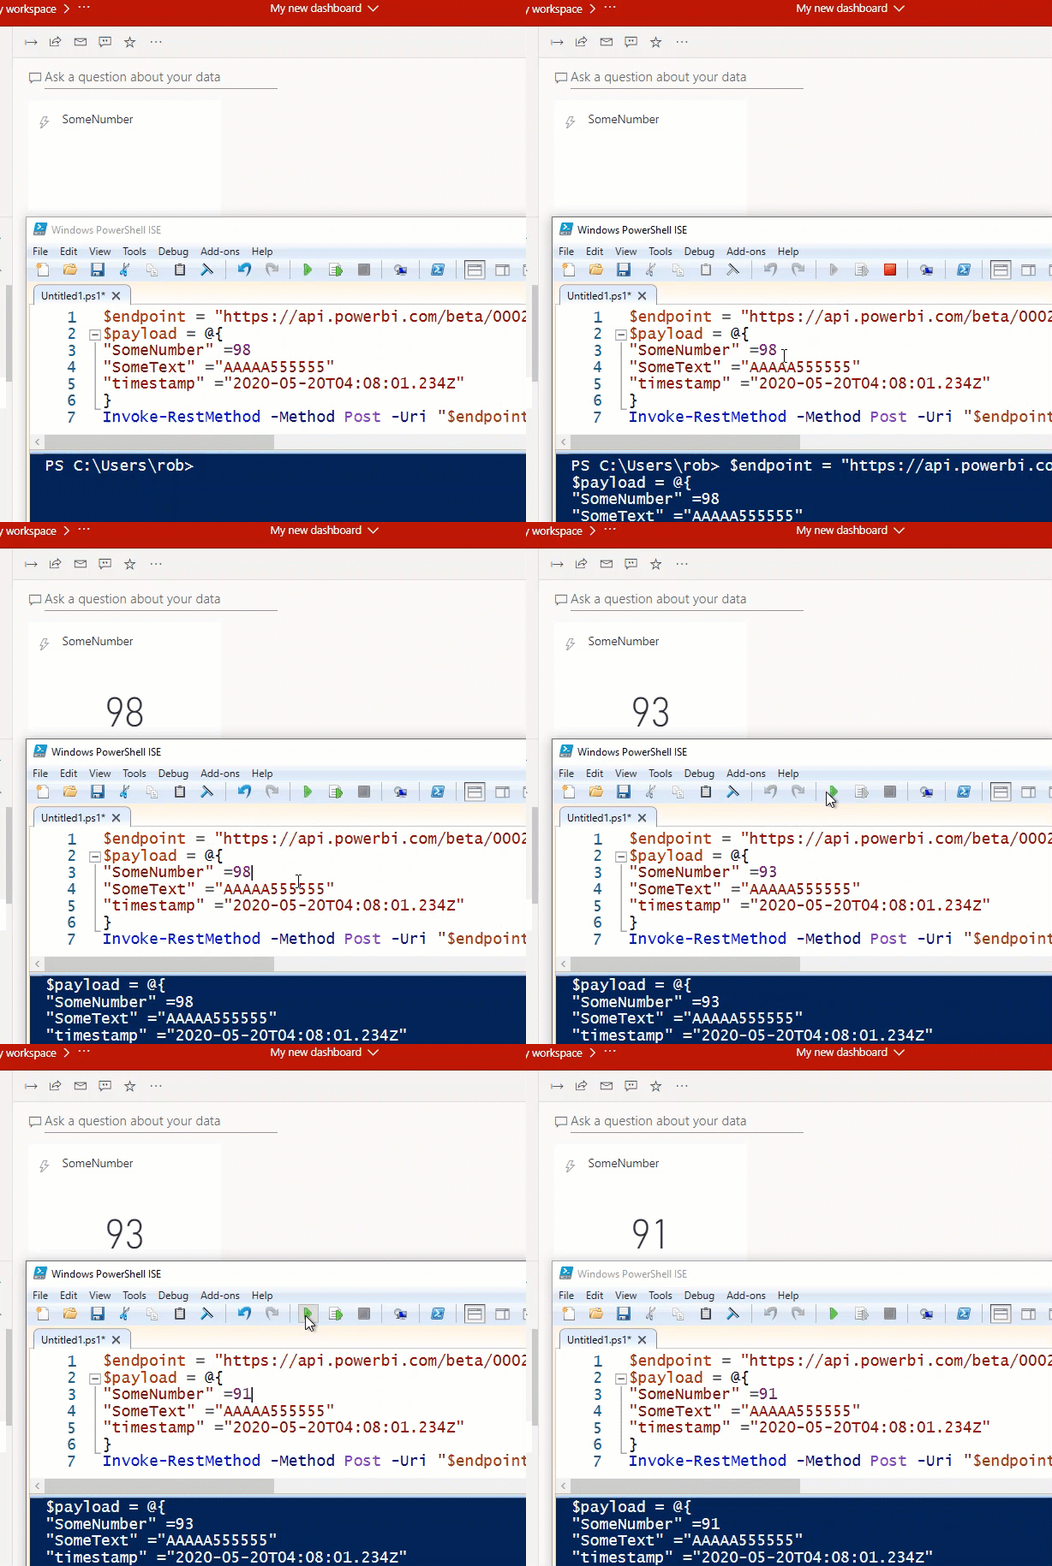
This happens regardless of whether or not we chose to do historical data analysis. It will show the latest row pushed in, regardless of whether the datetime column is older or newer. We push a new row, it replaces what’s in that tile. When this is all I want to do, I don’t even care too much about sending a timestamp column. Any data I send will disappear an hour later, and that’s fine for me.
But if we did choose that option, we can also create a report based on the dataset.
However, you can’t do this in Power BI Desktop. You have to do it from the service, where your dataset was defined.
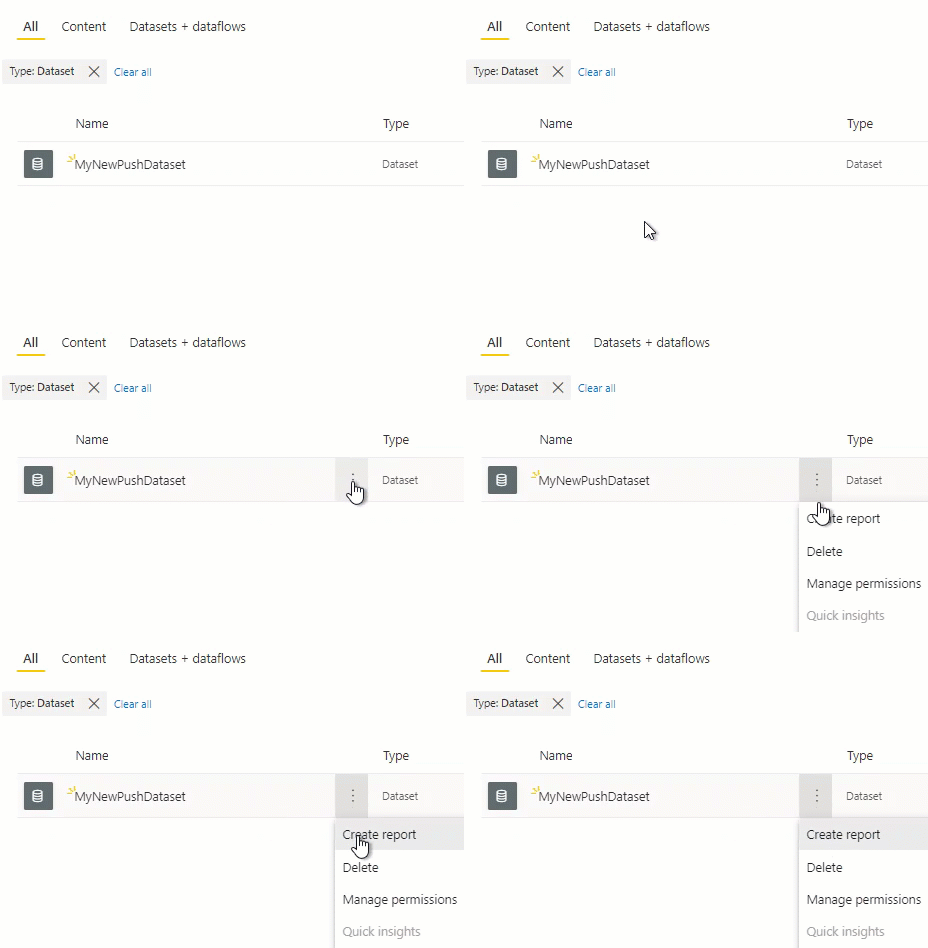
You can either choose New Report and then pick the dataset from the list, or (especially if you can’t see it in the list), you can pick “Create Report” from the dataset’s ellipsis.
Now I can create all my usual visualisations based on this data, showing multiple rows, and all that. In my example, because I didn’t change the timestamp value every time, I need to tell it explicitly “do not summarize” the number value, because I can’t edit the dataset except to change the field names and types. I certainly can’t do anything like setting default aggregation types. Also notice that the dataset contains a table called RealTimeData. I didn’t choose that – it was set for me.

At this point I find myself wondering about that 200k rows that it’s holding onto, and filtering to “Top N” can be handy, or filtering on the datetime column for relative time (being careful about UTC settings). Otherwise, you might find yourself inadvertently showing more data than you’d like.
But if I need to clear out my dataset at the start of each day, then that’s an option too. I just need to do it deliberately. Luckily, Power BI’s REST API is good for that too, and I can easily delete all the rows in a dataset with a new lines of PowerShell.
|
1 2 3 4 5 6 7 |
# Install/import the module if you need Import-Module -Name MicrosoftPowerBIMgmt; Connect-PowerBIServiceAccount; $DatasetID = (Get-PowerBIDataset | where {$_.Name -eq 'MyNewPushDataset'}).Id; $TableName = (Get-PowerBITable -DatasetId $DatasetID).Name; Invoke-PowerBIRestMethod -Method DELETE -Url "https://api.powerbi.com/v1.0/myorg/datasets/$DatasetID/tables/$TableName/rows" |
Clearing this will cause a dashboard tile to empty immediately, just like when we pushed the new data in.
But what about the report visual? That doesn’t refresh automatically. To get the report to show the latest data you need to do a refresh.
However, you can pin the visual to a dashboard, and see it refresh automatically.
I made a simple loop to send a row, wait a second, and repeat, and the response that I got was pretty useful. I had the visual filtered to the Top 3 based on the latest timestamp.
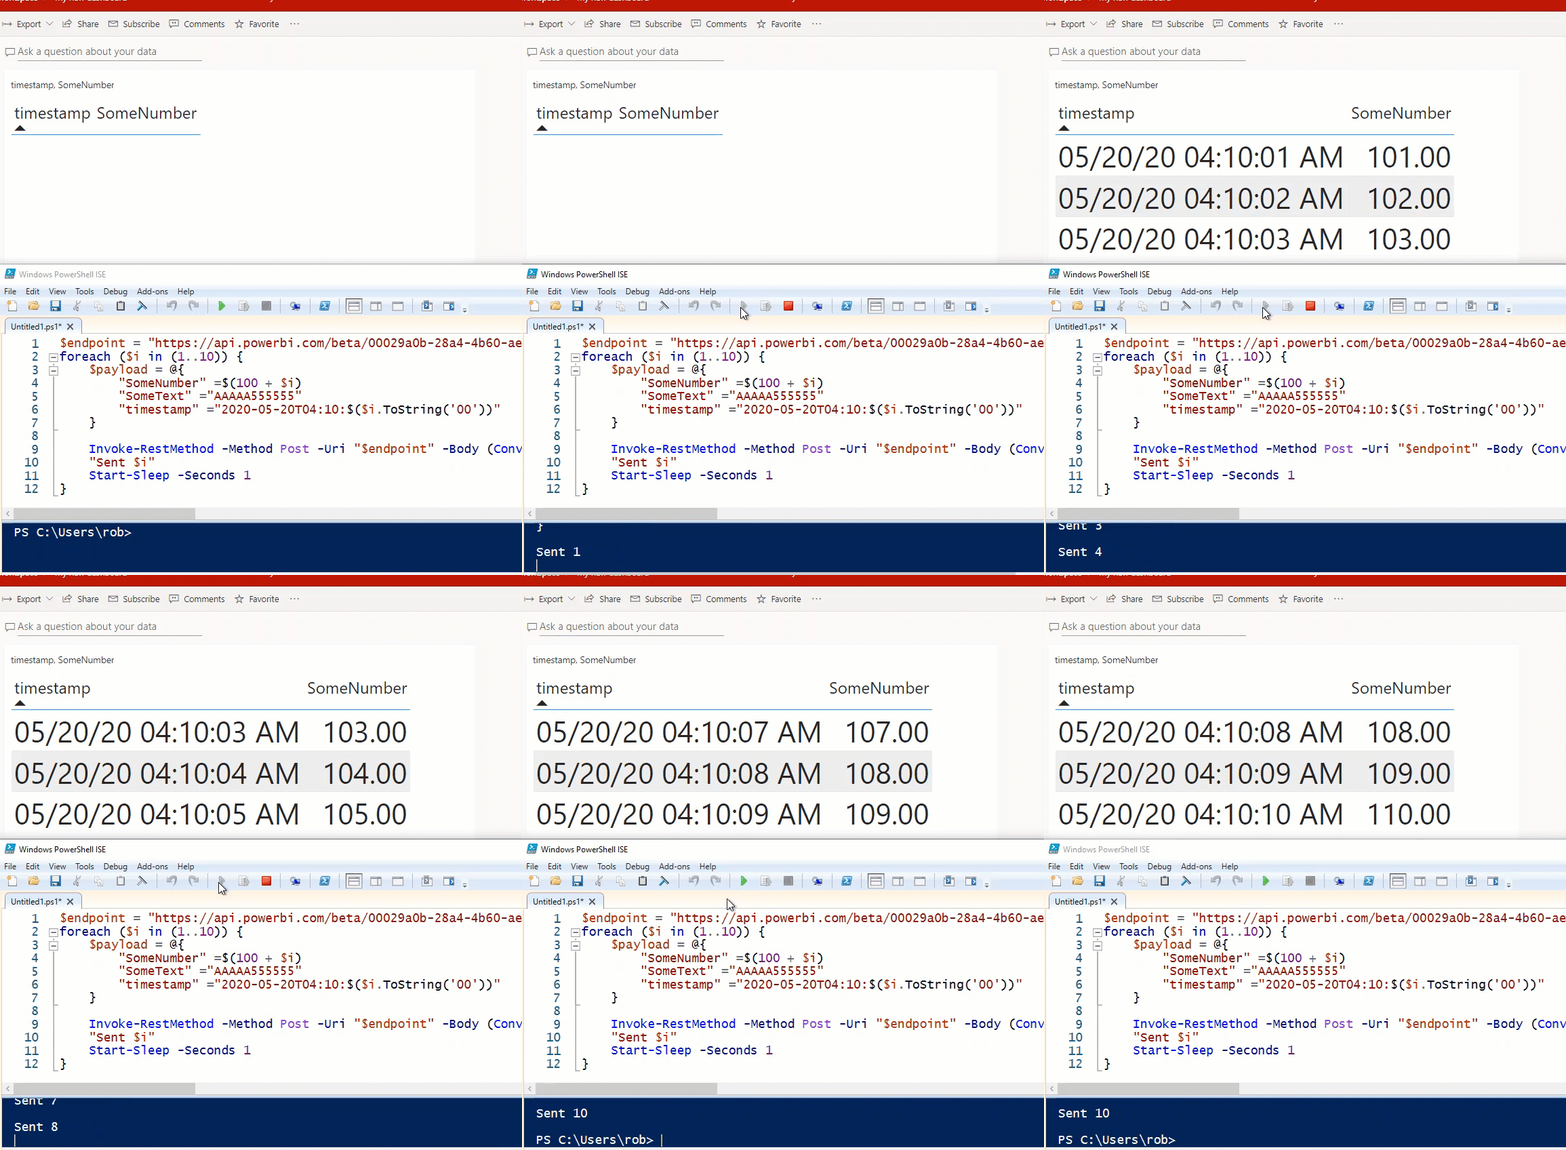
Now, it would be nice if reports could be set to auto-refresh when new data is pushed in, but having it in a dashboard is still very useful.
You see, streaming datasets don’t have to involve Azure Stream, but they can involve all your usual visuals if you choose the option for historical data analysis – it’s just that you won’t see your visuals refresh automatically unless you use a dashboard. Now that you understand these aspects of what’s going on and the couple of extra hoops you need to jump through, hopefully you can see a good use for these types of datasets. You can decide whether you you need to clear rows occasionally, figure out how you want to visual your data, and really start to make push datasets your own.


This Post Has 2 Comments
Thanks for such a detailed article Mr.Farley !
However , I want to configure Row Level Security by adding Roles to the dataset. How to do that in this streaming dataset?
Last time I looked you couldn’t do this. But I’m not sure what the reasons are.