
Are you a model designer or BI developer tasked with designing a data model and/or report from a series of user requirements or Agile User Stories? Do you know where to start, or what to try first? Here are some practical tips and techniques that I have used to design a great report model from Agile user stories.
I start by asking questions of the person requesting the report.
- Who will look at the report?
- Why will they look at the report?
- What are they trying to determine?
- What actions do they need to take from the report?
- What questions does the report need to answer?
- How often does the data need to be refreshed?
If you want business people to use the report, talk to them about their requirements
It’s vital to design a great data model from Agile user stories to find the people who will actually be using the report. Too often, I find that analysts or BI developers think that they understand the needs of the business, but they know the requirements from a technical perspective only.
If I’m working in an Agile project, I may be lucky enough to get a concise and detailed user story or something similar to articulate the requirements. It may look like this:
Look for the verbs and nouns
As the model designer (or BI developer), my job is to find the verbs and nouns in the story. Remember back to grade 3; verbs are words that show actions, motions, doing, or states of being; nouns are words or phrases that are the name of something or describe something.
Sometimes, a word might technically not be a verb or a noun, but another way to think about this exercise is to find the actions or acts (facts) and the descriptions (dimensions).
I will highlight the verbs, actions or acts (facts) and nouns or descriptions (dimensions) in your user story:
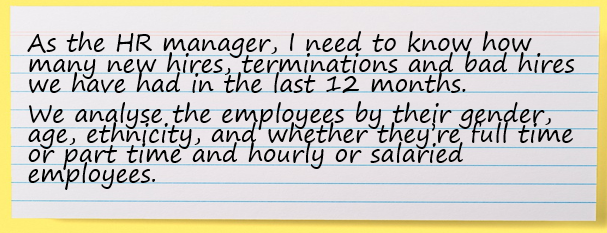
“As the HR manager, I need to know how many new hires, terminations and bad hires we have had in the last 12 months.
We analyse the employees by their gender, age, ethnicity, and whether they are full time or part time and hourly or salaried employees.”
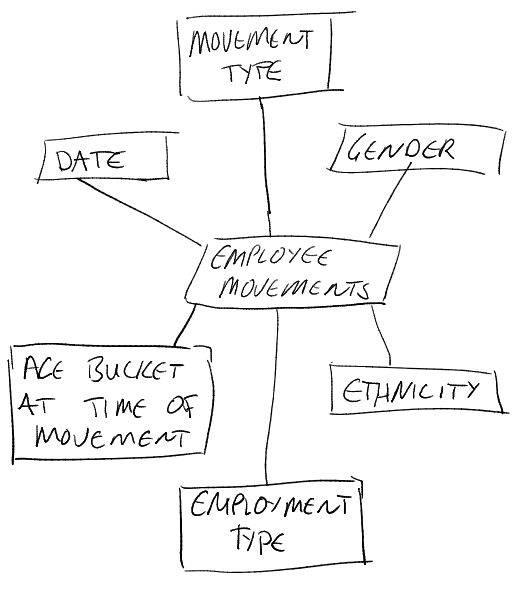
Conceptualise the star schema
From here, I will conceptualise the star schema. Just a note: I will ALWAYS begin on a whiteboard or a blank piece of paper (physical or online), as it’s the quickest and easiest to change and evolve.
Start with the Facts
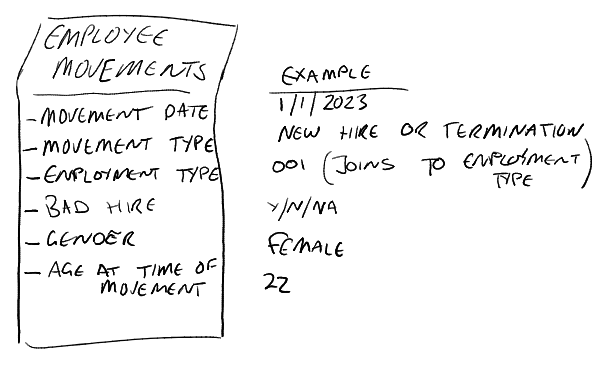
I start with the verbs, actions or acts (facts). Have I highlighted one or many in the user story? If there are many, do they all relate to the same business process? A good fact table models an actual process that the business does, for example, hiring people and terminating employees. An employee movements fact table could include new hires, bad hires and terminations and have the flexibility to include promotions or team changes later.
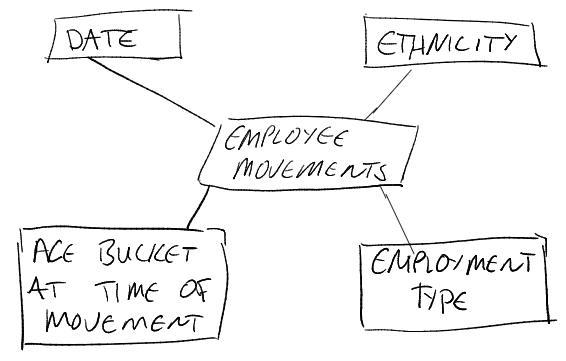
I will draw the employee movements fact table in the middle of the page.
How will we describe the Facts?
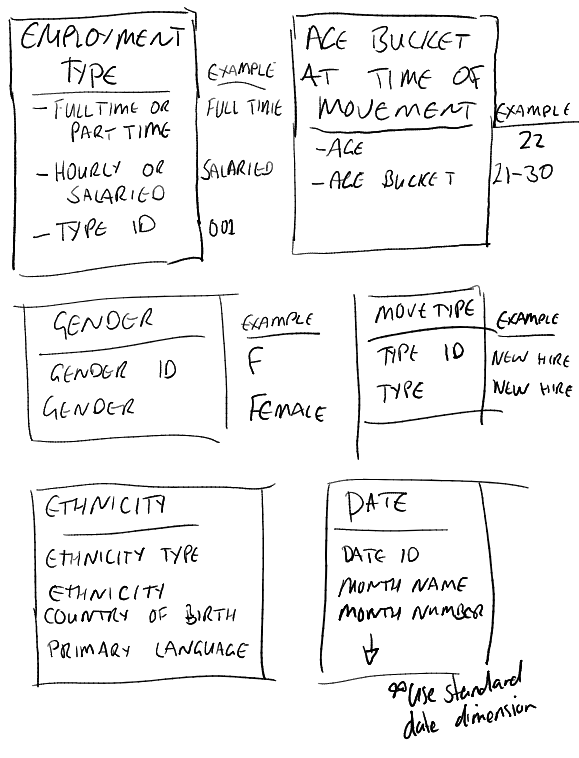
Now, I look for the nouns, attributes or descriptions (dimensions) I highlighted. I’ll ask the same questions as for the facts: Have I highlighted one or many in the user story? If there are many, do they all relate to the same business process? “12 months” is an attribute of a calendar, so I will need a time, date or calendar dimension (call it what you want). I’ll then add a dimension for gender and a dimension for ethnicity.
Age is a little more complicated because an employee’s age changes yearly. Instead of adding an Age dimension, I may add a date of birth to calculate age at any time, or age buckets (21 or younger, 22-30, 31-40, etc.) that will change less often. In this scenario, I might even prefer to rename the attribute to “age at the time of employee movement,” then I know it won’t change.
Full time, part time, hourly, and salaried can all relate to an employment type, so I’ll draw an employment type dimension in the star schema.
I also highlighted “bad” in relation to bad hires. First, I need to go to the business people and confirm what defines a “bad hire”. Then I need to ensure that I have all the data I need to determine if a hire is “bad”. This attribute could be a calculated column based on the business rule and other attributes or a new attribute derived from the source system. Finally, if I choose to implement an employee movements fact table, I will need an employee movements type to specify if the movement is a new hire, termination, promotion or team change. This may be an attribute in the employee movements fact table or a new dimension.
Record attributes and measures
Now that we have facts and dimensions listed start to record attributes and measures. You may be able to get these from the questions you asked and the user story, but if not, ASK.
Now design a great data model from Agile user stories – rework as needed
You may also realise that some dimensions are so small they don’t need an entire dimension to define. For example, gender has only 1 description field plus a primary key, and the primary key could be the same as the description. This applies to movement type as well. I can include the whole description on the fact table and remove the gender and movement type dimensions, which makes them “degenerate dimensions”. I can then remove the gender and movement type dimensions.
Determine where the data will come from
Which systems and objects/tables within the system contain the fields? Most likely, the business user is a user of the system, and they can step you through how they would find the data manually. Use this to understand the complexity of the data sources. Are there 10 different sources, or 1? Is all the data on a single screen, or must you navigate multiple places to find everything?
Ask more questions
Importantly, at this stage, ask questions about how the Facts and Dimensions connect to each other. If Budgets are in a different system to Actuals, is there a common identifier/dimension you can use? Do you need additional objects/tables to get ID columns that mean something?
If you don’t have the budget or time to develop the entire model, design and build a basic star schema. Be sure to include a fact table and multiple dimensions that directly connect to that fact table. You won’t get approval to build more if you can’t prove the value of the first part; if there is nothing for the user to see in the report, they won’t be willing to pay for more of that ‘nothing’.
The best way to get started designing a great report model from Agile user stories is to get the user story and begin drawing the star schema on a whiteboard or a blank piece of paper. Then keep changing it as you find out more information. I hope this helps you to understand the business requirements and translate them into a scalable data model. In my next post, I’ll talk about designing a report model from an existing report.
Happy designing!