
Previously, I’ve written about tips for designing a really great report model from Agile user stories. Catch up on it here (Useful tips for designing a really great report model from Agile user stories). Now, I’d like to present a few ideas for designing a user-friendly, scalable and re-usable Star Schema by interpreting an existing report or report mock-ups.
Where to start
I have worked as a business intelligence developer for several years, and I’m always asked: “How do you convert user requirements to a functioning data model?”
I follow the Kimball methodology. For more information, check out the official pages.
But, here are some specific tips on what works for me.
Firstly, understand that requirements evolve. Very few people know precisely what they want before they start, mainly because they don’t know what’s possible. Once I start developing a new report, especially in a new tool, they will ask for something new or different to the original requirements. This is why Agile principles work well in business intelligence development. The trick is to get as close as possible without doing more work than required. Do not get attached to the first data model; know and understand that it will evolve over time.
Before we get into more details, I follow a few ground rules when I interpret requirements; these include:
Have a process
Many stakeholders, especially those paying for the solution, don’t appreciate ‘loose’ requirements and poorly defined deliverables. To address their concerns, I show them a pre-defined process to gather requirements and build report parts or facts and dimensions. Each project may use a slightly different process, but create a method that works best for you. You can start with the one I describe below.
Set expectations
Once I know what process I will use, I explain that each iteration of the development will take a specific number of hours or days and what should be expected from each repetition. It’s essential to be clear on the process and what can be achieved each time you repeat it.
Always create a star schema
I don’t want to see data models that replicate the tables from the source data or ‘Flat’ data models, where everything is in one or two tables. These models perform poorly, are unscalable (try adding a new piece of data), and are challenging to understand and find things in. They often contain repeated data, only work when there is a single data source and are difficult to write DAX expressions on (I could rant for hours on why you need a star schema, but that’s reserved for another post). Regardless of size, I will always design and build a star schema for all reports. In case you are not familiar with star schemas, here are the basics:
Facts in the middle
- Also known as measure groups (in SSAS Multidimensional) because they measure things
- They align to a business process, or some event that happens in your business, e.g. a Sale is completed, a Customer places an Order
- Normally referred to in the plural, e.g. Sales, Orders
Dimensions on the points
- Describe the facts
- What you’d see in filters and groupings
- Normally referred to in the singular, e.g. Product, Date, People
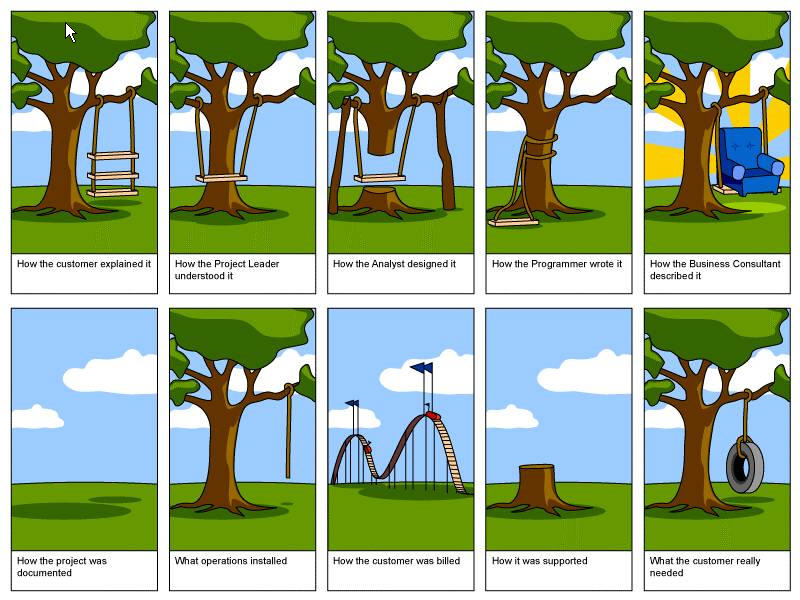
I understand that Power BI is an ELT (“Extract, Load, and Transform”) tool, as opposed to an ETL (“Extract, Transform, and Load”) tool, and individual queries need to be written for each source table. These queries become the tables in your model, but I still follow Fact and Dimension logic to split or combine source tables to ensure I create a star schema. Now that you have some ground rules, let’s review the reporting requirements. Remember this image about understanding requirements? It totally applies here. Your ability to understand the customers’ requirements is vital to delivering a brilliant, usable, well-performing, adaptable and scalable report.
Congratulations, you have been asked to replicate an existing report.
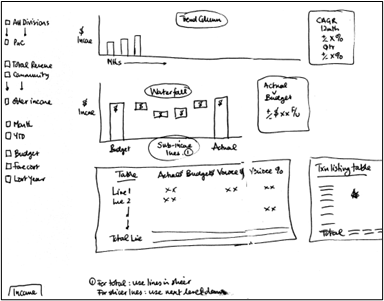
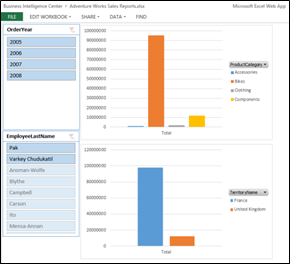
More often than not, customers (or clients/business users/stakeholders, call them what you want; it’s the person requesting the report) will ask you to rebuild an existing report, either from a new source system or because there is a problem with the existing report. Alternatively, you may get a report mock-up drawn on paper (or a napkin – yes, that has happened to me). Examining the sample or mick-up provided is essential as a first step in your process.
Star Schema from an existing report
No matter what, you need to create a Star Schema by interpreting this existing report and mock-up. Start with version 1 of the star schema by looking for the actions, acts or things that need to be counted (facts) and the descriptions, filters, and groupings (dimensions).
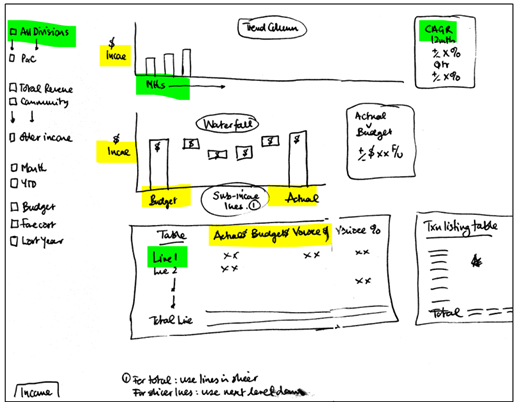
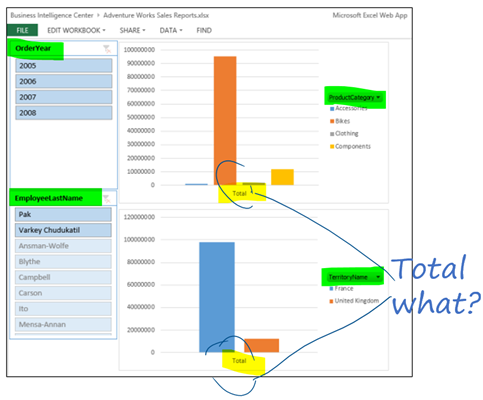
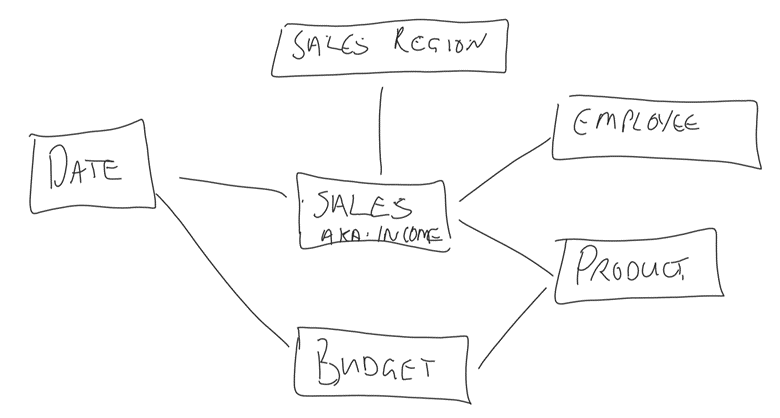
Just looking at these two sample reports, I can see that they need the following in the Star Schema for our existing report and mock-up:
Dimensions
- Division and Territory Name – could be combined into a Sales Region dimension.
- Employees – including Employee Last Name
- Product – including Product Category
- Lines (I’m not sure what this means)
- MHs (I’m not sure what this means)
- CAGR – 12 month, quarterly and Order Year – so ensure to include a Date dimension with quarters and all dates listed (to use Power BI’s inbuilt time intelligence features)
Facts
- Income
- Budget
- Actual (is this the same as Income?)
- Actual Variance to Budget $
- Actual Variance to Budget %
- Total (I don’t know what these charts are showing as the total amount)
As you can see, this process has identified some dimensions and facts to start the star schema design, but it has also highlighted some serious questions about what data is needed in the report. It’s vital at this stage to find the people who will actually be using the report. Too often, I find that analysts or BI developers think that they understand the needs of the business, but they know the requirements from a technical perspective only. Go and ask these questions of the businesspeople and customers who created the mock-up:
- What do you mean by Lines in the mock-up?
- What do you mean by MHs in the mock-up?
- Is Actual the same as Income? If they are different, how so?
- I don’t know what these charts show as the total amount. Can you please be more specific?
Once you have some answers, you can start to design the star schema. Just a note: I will ALWAYS begin on a whiteboard or a blank piece of paper (physical or online), as it’s the quickest and easiest to change and evolve.
It’s always a good idea to combine different requirements-gathering techniques to understand better what the customer wants from the reports. Refer to this post for more ideas (Useful tips for designing a really great report model from Agile user stories).
Once you are clear on the requirements, start to look at source systems and understand how the data is structured. This will undoubtedly form part of your process and improve the star schema. Remember to keep changing it as you find out more information.
I hope this gives you some understanding and ideas for designing a user-friendly, scalable and re-usable Star Schema by interpreting an existing report or report mock-ups.
Happy designing!