Tip: Don’t do it, do this instead
In this series of blog posts, I want to explain different ways to extrapolate business requirements to write great reports. In this post, we’ll look at steps to connect to source data to create a new Power BI report. Firstly, let me explain what I mean by “Great Reports”. These are reports that are user-friendly, scalable and reusable. Most importantly, reports that the business keeps using, well after you finish developing them.

Great reports MUST have a great data model (or semantic model for those who work in Power BI/Fabric) behind them, so most of my advice here is actually about the data model design, not the reports themselves. I work predominantly with Power BI, Fabric, and SQL Server Analysis Services, so my advice is tailored to those technologies. If you want to catch up on the previous posts, go to:
- Useful tips for designing a really great report model from Agile user stories
- Design a really terrific Star Schema by interpreting an existing report
Here are the connection details. Start developing!
Who has been told by a manager or business person to just connect to the source data and start creating a new report? Here is my tip:
DON’T DO IT
All Power BI and Fabric reports must have a semantic model, which Microsoft describes as “a logical description of an analytical domain, with metrics, business-friendly terminology, and representation, to enable deeper analysis.” – Source
If you try to build a report from a transactional source, you will end up with a data model replicating the tables structured from the source system, which is (hopefully) a third-normal form relational database. Or worse, a flat, single table because the API presented all the data in one endpoint. This is not ideal for a Power BI or Fabric Semantic model because it relies on many-to-many and bi-directional relationships. Many very smart people have written about why these are bad here and here, so I’m not going to repeat their teachings. Just know that a poorly designed data model can reduce the report performance, introduce logic errors and require complicated and erroneous DAX measures. You want your Semantic model to be dimensional, that is, a star schema.
What to do instead
Here are my recommended steps to connect to source data to create a new Power BI report:
Step 1: Talk to the business to identify the business problem or reporting opportunity
My recommendation is to follow the Kimball methodology. For more information, check out the official pages.
In this methodology, the Kimball Group says that you need to identify the business process, grain, dimensions, and facts to design a dimensional/semantic model. And “for a dimensional modeller, the business process is an event or activity which generates or collects metrics” Quote from Design Tip #69 Identifying Business Processes.

So, go back to your manager or business person and ask them any of the following questions:
- What business process do you want to report on?
- What business activity or event are you interested in?
- What about that activity or event is of interest?
- What behaviour in the business are you looking to understand more, track or change?
OK, that last question might be a bit deep for some managers, but it might also start a good discussion about what they really want the reports for. From there, you can treat their requirements as user stories and follow my advice in the Useful tips for designing a really great report model from Agile user stories.
If they still just want a report from a source system…
If the manager or business person still insists that they need a report from a source system, there are a few things you could educate them on:
- Business systems are large and complex. Do they want a report on all features and elements of the business system? If so, they’ll unfortunately be waiting a really long time for you to finish. Can they narrow down the scope to get you started? Or can they set a highest priority business element to start with?
- Off-the-shelf software is designed to meet the requirements of many different organisations/businesses/companies, not just yours. Therefore, they allow different configurations and implementation of business rules. Is there someone in the organisation that you can talk to about the config of the system and the business rules so that you don’t misinterpret the data?
- Regardless of how you receive your user requirements, there are still a number of questions about the security, timeliness and usability of your report that need to be asked. I will cover these questions in the next blog post, but I don’t want to forget to mention them here.
Maybe your manager has said that he needs a new report to analyse the patients who visit a healthcare practitioner for medical advice and leave with a medication prescription.
Step 2: Do some research to help yourself out
Operational systems are typically implemented for a specific business process or processes. For example, iChris is a HR software solution, Salesforce is a CRM, Xero is accounting software used for invoice management and payroll, and Microsoft Dynamics is an ERP and CRM suite. You could research the source system to find what business processes it supports. The trap here is to still focus on too many processes at once. You will need to prioritise one to start with. I like to remind my clients that “Priority 1” and “High Priority” are singular. It isn’t “Priority ones” or “High priorities”; there is no “s”; there can be only one.
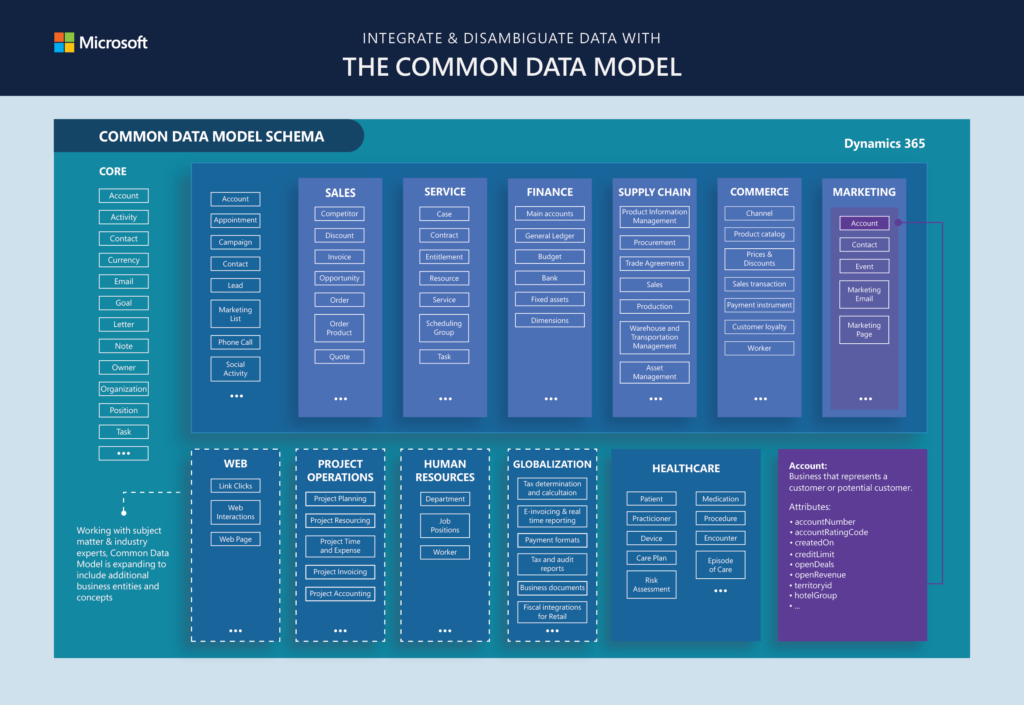
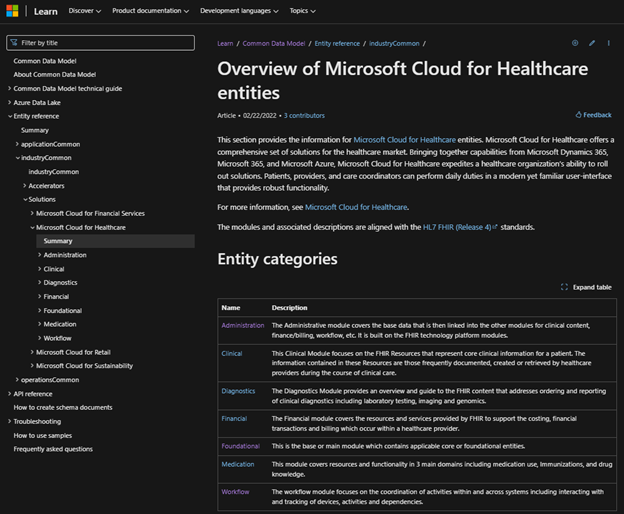
Next, you need to start to think about the grain, dimensions, and facts. Microsoft has published some articles on Learn about the Common Data Model (https://learn.microsoft.com/en-us/common-data-model/), which would be very helpful to look at next. Business processes like healthcare, human resources, campaigns, budgeting, sales, etc., are described in detail, along with attributes, semantic metadata, and relationships.

These published resources can save you a heap of time and help highlight anything in the dimensional/semantic model that you may have missed because you don’t have someone to ask about the business rules or because you’re a report developer, not a subject matter expert in healthcare, sales, finance, marketing, etc.
You don’t need to use Dynamics 365 to leverage the resources available for the subject areas. The Learn pages and GitHub repo are free and available to anyone.

Step 3: Document the business process, grain, dimensions, and facts
Research has been done, but you must still formally identify the business process, grain, dimensions, and facts to design a dimensional/semantic model. It’s worth noting that the business process often becomes the Fact or Facts in your model. Remember, your manager needs a new report to analyse the patients who visit a healthcare practitioner for medical advice and leave with a medication prescription. This feels complicated because the person requesting the report, the Kimball books and the CDM mentioned above all use slightly different language to say the same things, so I break it down like follows:
Business Process
| Requested | Kimball | CDM |
| A patient visits a healthcare practitioner and receives a medication prescription **Bold text shows that there are actually 2 processes, or Fact table articulated here | Patient Encounter Workflow | Administration Encounter |
Dimensions
| Requested | Kimball | CDM |
| Date Healthcare practitioner Patient | Date Physician Patient | Date Clinical Care Team Encounter Participant |
Facts
| Requested | Kimball | CDM |
| Visits Grain: One Administration Encounter for each visit to a healthcare practitioner | Patient Encounter Workflow | Administration Encounters |
| Medication Grain: One Medication for each medication prescription received during a visit | Medications | Medication Core |
Step 4: Draw the model on paper
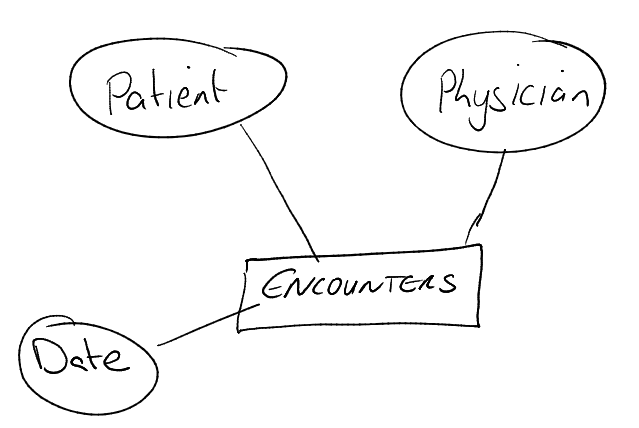
As I’ve said in previous posts, I will ALWAYS draw the dimensional/semantic model on a whiteboard or a blank piece of paper (physical or online), as it’s the quickest and easiest to change and evolve.

Then, use the drawing to see if you can answer some of the questions your manager or business person originally asked. For example;
- “I want to know how many patients who visit a healthcare practitioner for medical advice leave with a medication prescription” – the model above allows you to slice the Medications by Patient, so this requirement would be met.
- “I want to know, on average, how often a healthcare practitioner prescribes medication to patients” – the model includes physician, number of encounters, and number of encounters with a prescribed mediation, so this requirement can be met.
- “I want to know the average time it takes patients to fulfil their prescription” – the model doesn’t appear to include any prescription fulfilment information, so this requirement would not be met.
Step 5: Load the data into your model
Now, you are finally ready to start developing in Power BI by loading data from the source system into your carefully designed dimensional/semantic model.
Please always apply this well-known theory:

That means that, if you can, transform the data at the source system layer before you load it into Power Query or Pipelines. This may mean:
- Create T-SQL views in a SQL Server database
- Create reports in the application (Salesforce and Xero are good at this) and then connect Power Query to the report
- Build or use a custom API from the application development tools
If you can’t control the source system enough to transform your data before ingestion, consider implementing a Medallion architecture in Fabric. Tasks Flows are a great new feature to help here.

Finally, after you have designed a dimensional/semantic model that reflects a business process with facts and dimensions at the appropriate grain and you have loaded the data, you can start developing the report visuals.
I hope these recommended steps to connect to source data to create a new Power BI report will get you started when you’ve been told by a manager or business person to create a report from raw, system data.
- Talk to the business to identify the business problem or reporting opportunity. Always ask more questions to get to the business process and deeper requirements for the report.
- Do some research to help yourself out. You don’t have to start from scratch.
- Document the business process, grain, dimensions, and facts.
- Draw the model on paper or a whiteboard.
- Load the data into your model and build visuals.
Happy designing!